
Key Takeaways
- U.S. home improvement spending has increased 60% since 2019 (from $494B to $790B).
- Americans now spend an average of 1.7% of their household income on routine home maintenance and 11.3% on bigger home improvement projects.
- Routine maintenance costs hit Miami homeowners hardest at 2.4% of the average household income. Milwaukee is the most affordable metro for routine maintenance, with residents spending just 1.1% of their household income.
- Phoenix and Denver homeowners invest most heavily in home improvements, dedicating over 11% of the average household income. Households in Detroit invest the least (6.4%), partly due to their high propensity for DIY.
American spending on home improvements up 60% since 2019
Our homes are central to day-to-day life, with Americans spending an average of 18 hours and 12 minutes at home each day. Moving house? That's becoming rare. Just 7.8% of Americans relocated in 2023, hitting the lowest moving rate since the 1940s.
This stay-put trend has driven a surge in home improvements.
The number of projects has increased 22% from 113 million in 2019 to 138 million in 2023. Even more striking is the 60% jump in spending, from $494 billion to $790 billion.
These escalating expenses raise an important question: How affordable are home improvements across different U.S. regions?
To answer this, we analyzed data from the latest American Housing Survey.
The American Housing Survey collects data from the top 15 metros in the U.S., plus a selection of other rotating metros. For this study, we looked at 20 metros which were included in both the 2019 and 2023 survey releases.
Residents in Miami spend 2.4% of their household income on routine home maintenance
First, we looked at routine maintenance.
Routine home maintenance - for example, gutter cleaning or basic HVAC maintenance - now costs American households an average of $1,356 per year. This represents 1.7% of a typical household income, up from 1.4% in 2019, when average spend was $931.
Let’s break it down by area.
| Metro area | Average annual cost for routine home maintenance | % of household income spent on routine maintenance 2023 | % of household income spent on routine maintenance 2019 | % point difference 2019-2023 |
| Miami, FL | $2,055 | 2.4% | 1.7% | 0.7% |
| Los Angeles, CA | $2,157 | 1.9% | 1.4% | 0.6% |
| New Orleans, LA | $1,640 | 1.8% | 1.3% | 0.5% |
| New York City, NY | $2,172 | 1.8% | 1.6% | 0.3% |
| Philadelphia, PA | $1,825 | 1.7% | 1.4% | 0.3% |
| Boston, MA | $2,103 | 1.6% | 1.9% | -0.3% |
| Dallas, TX | $1,777 | 1.6% | 1.0% | 0.6% |
| Riverside, CA | $1,522 | 1.6% | 1.3% | 0.3% |
| San Francisco, CA | $2,122 | 1.5% | 1.2% | 0.3% |
| Detroit, MI | $1,381 | 1.5% | 1.1% | 0.4% |
| Houston, TX | $1,553 | 1.5% | 1.1% | 0.3% |
| Atlanta, GA | $1,554 | 1.4% | 1.0% | 0.4% |
| Cleveland, OH | $1,325 | 1.4% | 1.1% | 0.3% |
| Seattle, WA | $1,637 | 1.3% | 1.1% | 0.2% |
| Washington DC | $1,843 | 1.3% | 1.1% | 0.2% |
| Chicago, IL | $1,309 | 1.3% | 1.2% | 0.0% |
| Phoenix, AZ | $1,250 | 1.2% | 0.9% | 0.3% |
| Cincinnati, OH | $1,294 | 1.2% | 0.9% | 0.3% |
| Denver, CO | $1,463 | 1.2% | 1.0% | 0.2% |
| Milwaukee, WI | $1,169 | 1.1% | 1.0% | 0.1% |
Miami, Los Angeles, and New Orleans emerge as the least affordable cities for home maintenance.
In Miami, maintenance eats up 2.4% of household income - nearly double what homeowners pay in more affordable metros like Milwaukee (1.1%) and Denver (1.2%).
While maintenance costs are higher in places such as San Francisco and Boston - the higher wages in these cities makes the increased costs more affordable.
Comparing the 2023 figures to 2019, the affordability gap is widening.
In the three least-affordable cities, home maintenance now takes up 0.6 percentage points more of people's income than it did in 2019. Meanwhile, in more affordable cities like Milwaukee and Denver, it's only risen by 0.15 percentage points
Only one city, Boston, has seen affordability improve since 2019.
Phoenix households dedicate 11.9% of their income to home improvements
Next, we considered general home improvements and which metros spend the most on these.
General home improvements are upgrades to a house such as adding a swimming pool, remodeling, or installing a security system, along with bigger jobs like replacing the roofing or replacing a driveway.
In total, Americans spent $790 billion on home improvements in 2023, which works out to just over $9,000 per household, or 11.3% of the average household income. Roofing replacement costs have also surged during this time—a trend we've observed firsthand through our roofing calculator which tracks changes in labor, materials, and regional pricing across the country.
This is up from $494 billion, or 9% of the average household income in 2019.
Let’s break it down by the surveyed metros:
| Metro area | Average annual spend on home improvements | % of household income spent on home improvements 2023 | % of household income spent on home improvements 2019 | % point difference 2019-2023 |
| Phoenix, AZ | $12,026 | 11.9% | 7.9% | 4.0% |
| Denver, CO | $14,217 | 11.5% | 12.2% | -0.7% |
| Milwaukee, WI | $12,018 | 11.2% | 6.9% | 4.3% |
| Riverside, CA | $10,586 | 11.0% | 6.2% | 4.8% |
| Seattle, WA | $13,350 | 10.9% | 8.8% | 2.1% |
| Cincinnati, OH | $11,403 | 10.7% | 6.2% | 4.5% |
| Cleveland, OH | $10,070 | 10.7% | 7.0% | 3.7% |
| New Orleans, LA | $9,350 | 10.5% | 6.5% | 4.0% |
| Boston, MA | $12,860 | 9.9% | 12.6% | -2.7% |
| Washington DC | $14,050 | 9.8% | 7.9% | 1.9% |
| Miami, FL | $8,298 | 9.5% | 8.1% | 1.4% |
| New York City, NY | $11,395 | 9.5% | 5.6% | 3.9% |
| Dallas, TX | $10,347 | 9.4% | 7.6% | 1.8% |
| San Francisco, CA | $13,009 | 9.3% | 6.9% | 2.4% |
| Philadelphia, PA | $9,751 | 9.3% | 6.9% | 2.4% |
| Los Angeles, CA | $9,935 | 8.9% | 8.8% | 0.1% |
| Houston, TX | $8,116 | 7.8% | 7.1% | 0.7% |
| Chicago, IL | $8,100 | 7.8% | 6.9% | 0.9% |
| Atlanta, GA | $7,786 | 7.1% | 4.8% | 2.3% |
| Detroit, MI | $5,817 | 6.4% | 5.4% | 1.0% |
Interestingly, the cities that dedicate the most amount of money towards home improvements are the ones where routine maintenance is more affordable.
Households in Phoenix, Denver, and Milwaukee allocate over 11% of their household income to home improvements.
While in Detroit, only 6.4% of a household's income goes towards home improvements.
The national average of 11.3% is notably higher than most of the metros sampled in this survey. Given that our sample represents America's 15 largest metros, this suggests households in smaller, unsurveyed metros are spending a higher portion of their income on home improvements, driving up the national average.
Top and bottom spending metros
In general, the top-spending cities tend to do more discretionary improvements such as kitchen remodels or room additions.
While the bottom spending cities tend to focus more on essential work like plumbing and electrics.
Phoenix
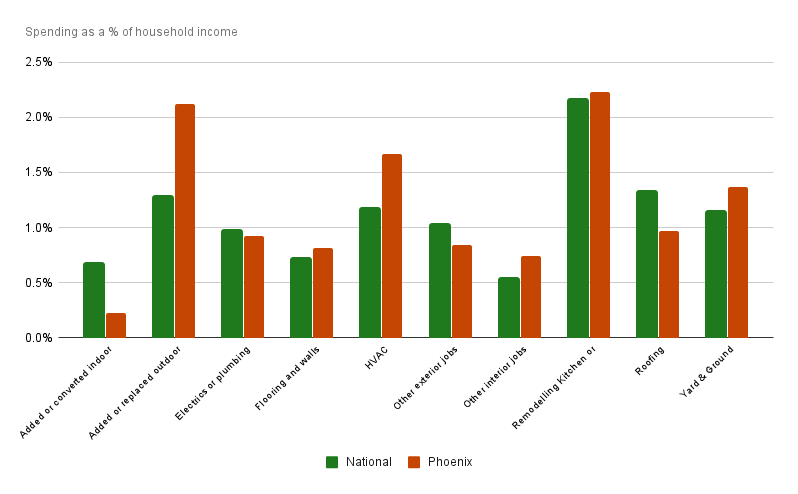
Phoenix's extreme heat shapes how residents invest in their homes.
The metro sees significantly higher spending on HVAC systems, with households investing $1,700 a year on average compared to the national figure of $950. Swimming pools are another weather-driven priority - Phoenix accounts for 3.5% of all pool installations despite having only 1.5% of U.S. households.
Phoenix households also spend more than average on other outdoor improvements like landscaping, sprinkler systems, and decking.
According to data from 2021, roofing costs in Phoenix have increased by 74%, reflecting a sharp rise in home improvement expenses in the area.
Denver
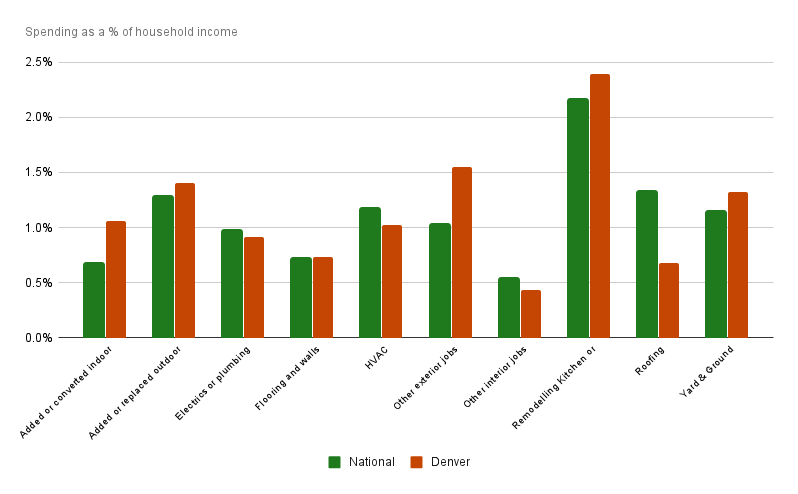
While Phoenix's spending is concentrated in a few weather-driven categories, Denver's renovation patterns show smaller increases across multiple areas.
The largest overindex is in the porches, patios, and decking category - with households investing 1% of their income - double the national average of 0.5%.Window and door replacements also see higher spending, along with room conversions. Given that Denver's remote workforce jumped from 9% to 22% since 2019, it’s likely there were a lot of office conversions going on.
According to data collected in 2021, roofing costs in Denver have surged by more than 222%, reflecting a dramatic increase in home improvement expenses over recent years.
Milwaukee
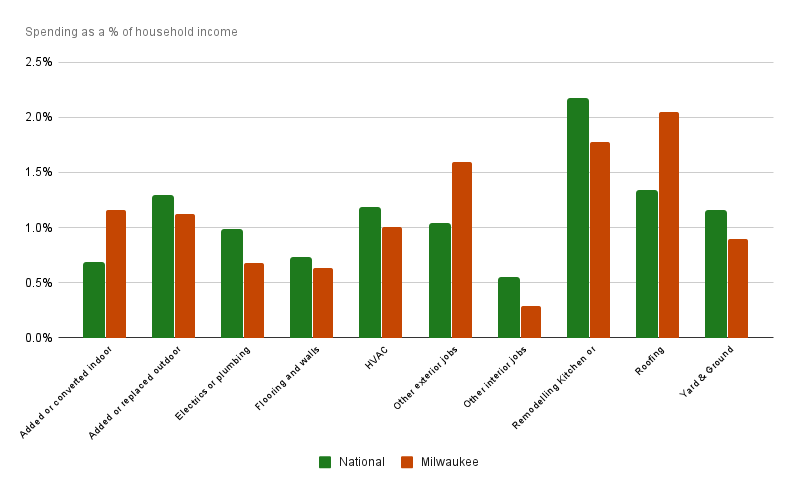
Milwaukee's harsh winters and freeze-thaw cycles drive distinctive spending patterns. Roofing commands 2% of household income versus the national average of 1.3%, while spending on siding, windows, and doors also exceeds national norms.
The metro also has an older housing stock, with a median house age of 1964 vs the national average of 1979, which will drive additional maintenance needs.
Additionally, roofing costs in Milwaukee have risen by nearly 14% since 2021, reflecting steady growth in material and labor expenses across the region.
Detroit
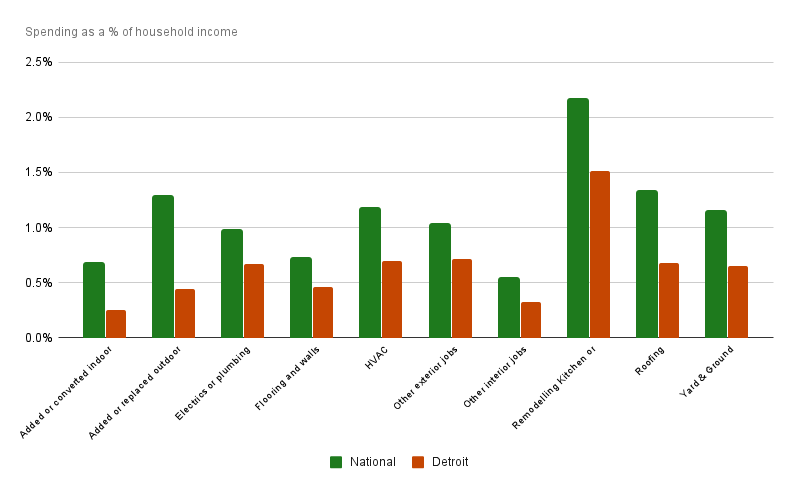
Detroit shows lower spending across the board, under-indexing in every renovation category.
There are two main reasons behind this.
First, Detroit households focus on necessary repairs rather than elective improvements such as remodels. And they spend drastically less than average on outdoor projects. Residents invest just $757 annually on yard and lot improvements - roughly half the national average of $1,423.
Second, over 41% of home renovation projects in Detroit are carried out DIY - which is the highest of any metro in this study.
Also, Roofing costs in Detroit have seen a modest increase of approximately 1.4% since 2021, indicating relatively stable pricing in the area.
Atlanta
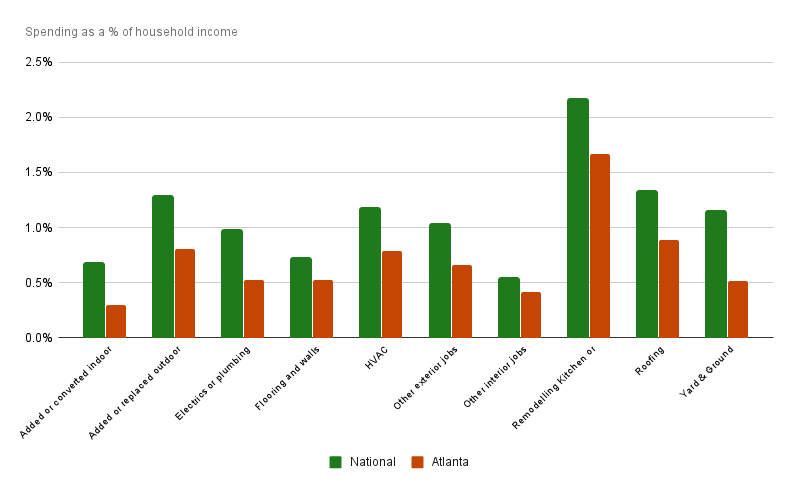
Atlanta also shows consistently lower spending across all home improvement categories compared to national averages.
The biggest spending gaps appear in yard improvements, where Atlanta homeowners spend just 0.5% of their income compared to the national average of 1.2%. Room conversions also lag, with just 0.3% of income going to these projects versus 0.7% nationally.
The metro's lower spending patterns can be partly attributed to the city's newer housing stock - the median home was built in 1996, meaning many properties simply need less work.
With data collected in 2021, roofing costs in Atlanta have increased by nearly 136%, highlighting a significant rise in home improvement expenses over the past few years.
Chicago
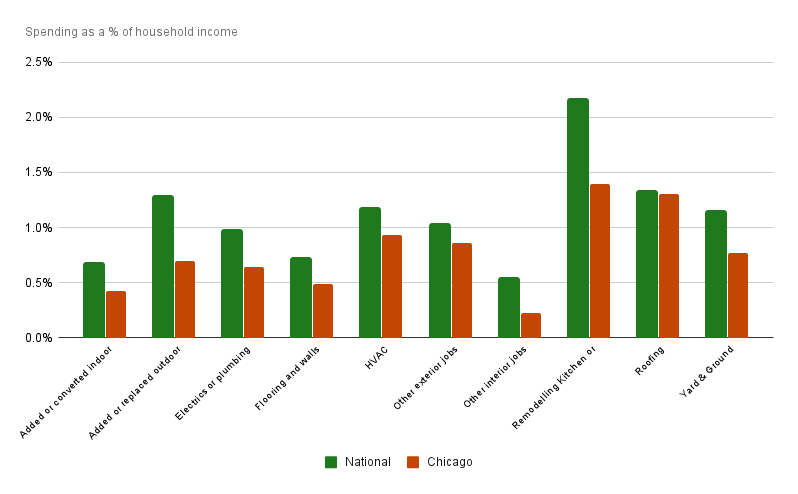
Like Denver and Atlanta, Chicago follows a pattern of lower-than-average spending across most home improvements, with one exception: roofing, which matches the national rate of 1.3% of household income.
The city sees notably lower spending on kitchen and bathroom remodels (1.4% vs national 2.2%) and outdoor structures (0.7% vs national 1.3%). These patterns likely stem from Chicago's harsh winters limiting outdoor living spaces and its high concentration of multi-unit buildings constraining renovation options.
Roofing costs in Chicago have increased by over 21% since 2021, reflecting ongoing inflation in material and labor prices across the region.
Methodology
This report by Instant Roofer, a service that provides free roofing estimates powered by AI, analyzes how much households in different U.S. metros are spending on routine home maintenance (e.g. HVAC servicing, plumbing repairs, and gutter cleaning) and home improvements (e.g. kitchen remodels, bathroom renovations, and roof replacements). It also examines what percentage of the average household income these expenses represent to evaluate overall affordability.
Data on spend, type of project, and number of projects was taken from the American Housing Survey 2023 (the latest data available) and the American Housing Survey 2019.
Data on household income and median home age was taken from the 2023 American Community Survey and the 2019 American Community Survey. Income figures were adjusted for Regional Price Parities taken from The Bureau of Economic Analysis.
The universe for both sets of data was owner-occupied households.
The following metros were included: Atlanta, Boston, Chicago, Cincinnati, Cleveland, Dallas, Denver, Detroit, Houston, Los Angeles, Miami, Milwaukee, New Orleans, New York City, Philadelphia, Phoenix, Riverside, San Francisco, Seattle, and Washington DC.
These metros were included in both the 2019 and 2023 American Housing Survey. The survey only studies a subset of metros each year.
Routine maintenance refers to recurring tasks needed to maintain the home's current condition.
Home improvements are larger projects that enhance or upgrade the home's features.
Note: Projects related to disaster repair were removed from the data.
Additional Sources
- Sharkey, Patrick. 2024. “Homebound: The long-term rise in time spent at home among U.S. adults” Sociological Science 11: 553-578.
- The 2023-2024 HireAHelper Moving Migration Report
- U.S. Census Bureau, U.S. Department of Commerce. "Selected Economic Characteristics." American Community Survey, ACS 1-Year Estimates Data Profiles, Table DP03, 2023.
Fair Use & Redistribution
You are welcome to share or republish these images and data. We only ask that you kindly attribute the authors by linking to instantroofer.com or this article to help readers access the full research and methodology.